In this article, we will analyse the transient cooling profile of an apple section inside a refrigerator.
Problem Definition and Assumptions
The apple in our example has a diameter of 80 mm and initial temperature of 20.0°C. The apple is placed inside a refrigerator with a constant air temperature of 3°C. The convective heat coefficient of the air is assumed to be 15 W/m².K.
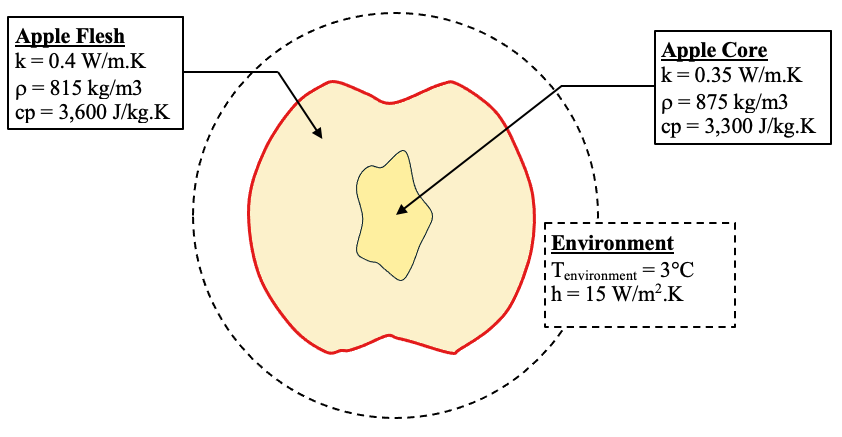
Sketch
Apple Section
Based on the physical arrangement, heating and exposure conditions, the heat transfer process can modelled as transient and one-dimensional under the following assumptions:
Uniform Convection: Convective heat transfer is applied uniformly around the surface of the apple.
Constant Condition: Refrigerator air temperature is constant.
One-Dimensional Flow: Temperature gradients and heat flux in the depth direction is negligible.
Transient Problem: The system represents short-term heat loss per unit area following placement in the fridge as we are interested in the cooling time.
[Note: This 2D problem is not modelled as steady-steady as eventually the temperature of the apple will match the air temperature inside the refrigerator.]
The .txt input file for the HeatCond2D model is available for download here.
If you have any queries or feedback regarding this article, please contact us.
Step-by-Step Heat Transfer Analysis
We will begin by creating a section of the apple.
Open the HeatCond2D app and tap on the Section Page. Ensure that <Geometry> is selected.
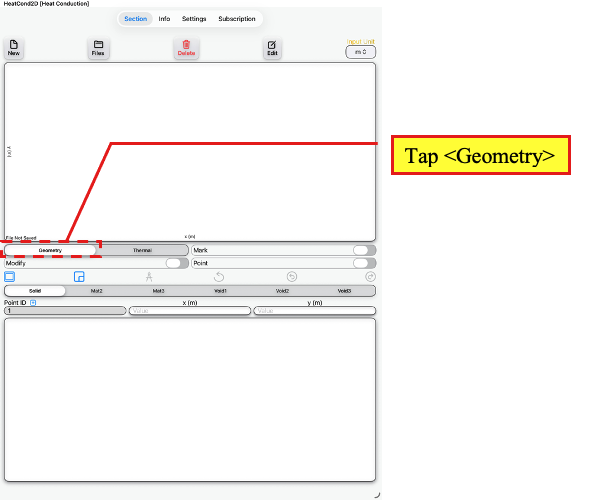
Section Page
Tap <Geometry>
Tap <Solid> to ensure that the Solid Element is selected. We will create the apple flesh as the Solid Element and apple core as the Mat2 Element.
Next tap on the Section Template button to access the Section Template Page.
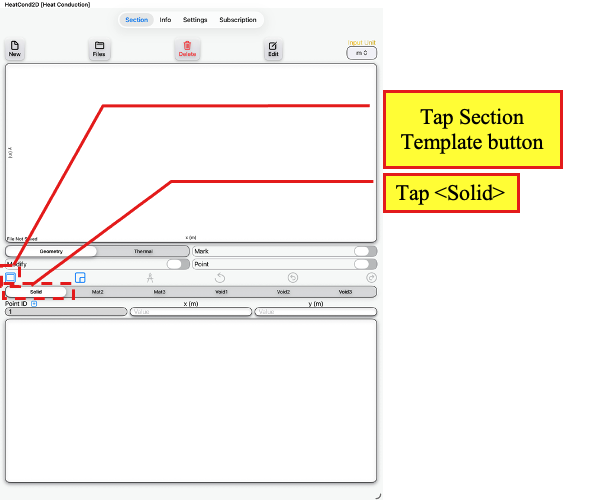
Section Page
Tap <Solid>
Tap Section Template button
On the Section Template Page, tap on the Coordinates button to bring up a template to input a list of coordinates.
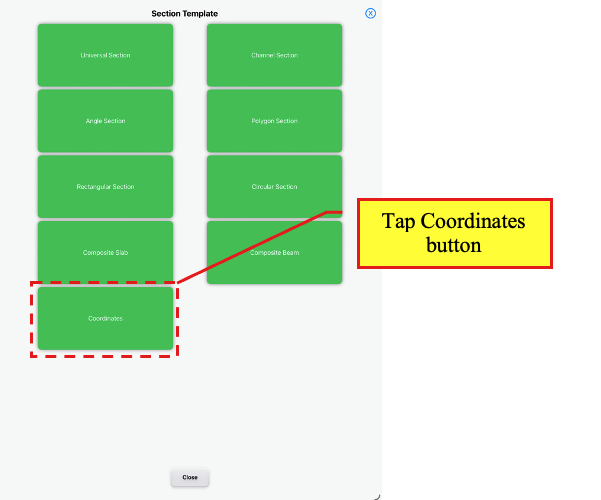
Section Template Page
Tap Coordinates button
On the Coordinates Template Page, under Input Unit, select mm to change the unit.
Select Solid under <Element>.
Next, use your preferred third-party artificial intelligence (AI) generator to generate the coordinates. Please note that AI generators may not always generate the desired coordinates so adjustments to the prompts may be required.
Enter the following example prompt to the AI generator:
“Generate a 2D vertical apple cross-section with an outer skin (80 mm wide) and an internal core (20 × 34 mm) with (0,0) is the centre of the apple. Generate at least 48 unique (x,y) coordinates for each boundary, with closed counter-clockwise loops, and output the complete coordinate lists outer_skin_vertical and apple_core in millimetres.”
Example coordinates for the outer skin:
outer_skin_vertical = [
(40.00, 0.00), (39.69, 5.55), (38.78, 11.03), (37.26, 16.37),
(35.14, 21.50), (32.42, 26.35), (29.12, 30.82), (25.24, 34.79),
(20.72, 38.00), (15.46, 39.67), (10.09, 38.53), (5.44, 35.49),
(0.53, 33.03), (-4.58, 34.87), (-9.16, 38.03), (-14.40, 39.68),
(-19.77, 38.47), (-24.43, 35.47), (-28.43, 31.62), (-31.84, 27.23),
(-34.67, 22.45), (-36.90, 17.37), (-38.54, 12.06), (-39.57, 6.60),
(-39.99, 1.06), (-39.80, -4.49), (-39.00, -9.99), (-37.60, -15.36),
(-35.59, -20.54), (-32.99, -25.45), (-29.80, -30.00), (-26.02, -34.07),
(-21.59, -37.40), (-16.41, -39.31), (-10.92, -38.83), (-5.80, -36.66),
(-0.53, -35.02), (4.84, -36.22), (9.91, -38.49), (15.35, -39.42),
(20.66, -37.91), (25.23, -34.77), (29.12, -30.82), (32.42, -26.35),
(35.14, -21.50), (37.26, -16.37), (38.78, -11.03), (39.69, -5.55)
]
Copy the list of coordinates for the outer skin to the text field in the template and tap <Create> to create the section and return to the Section Page.
A dialog box will appear if the section is not closed. Tap the OK button to close the section.
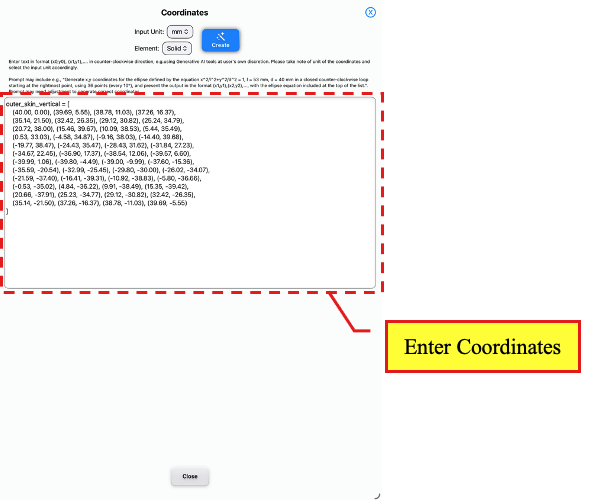
Coordinates Template Page
Change unit and enter coordinates
Back on the Section Page, tap on <Mat2> which will be used for the apple core.
Tap on the Section Template button to access the Section Template Page.
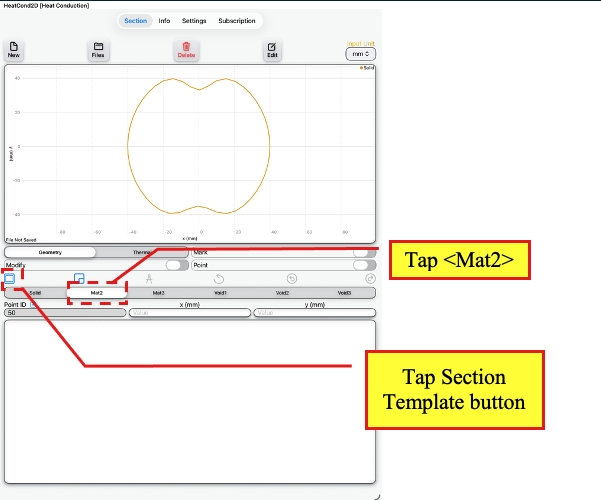
Section Page
Tap <Mat2>
Tap Section Template button
On the Section Template Page, tap on the Coordinates button which will bring up a template to input a list of coordinates.
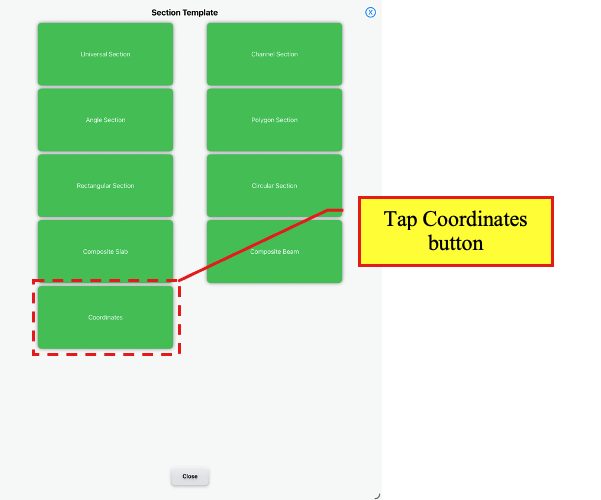
Section Template Page
Tap Coordinates button
On the Coordinates Template Page, under Input Unit, select mm to change the unit.
Select Mat2 under <Element>.
Example coordinates for the core:
apple_core = [
(11.50, 0.00), (11.24, 2.01), (10.47, 3.88), (9.28, 5.52),
(7.88, 6.99), (6.80, 8.69), (6.33, 10.66), (6.05, 12.67),
(5.69, 14.66), (5.09, 16.60), (3.99, 18.28), (2.11, 18.73),
(0.48, 17.56), (-0.75, 15.95), (-1.95, 14.31), (-3.73, 13.51),
(-5.74, 13.75), (-7.71, 13.36), (-9.09, 11.92), (-9.73, 10.00),
(-9.85, 7.98), (-9.64, 5.97), (-9.22, 3.98), (-8.75, 2.01),
(-8.50, -0.00), (-8.75, -2.01), (-9.22, -3.98), (-9.64, -5.97),
(-9.85, -7.98), (-9.73, -10.00), (-9.09, -11.92), (-7.71, -13.36),
(-5.74, -13.75), (-3.73, -13.51), (-1.95, -14.31), (-0.75, -15.95),
(0.48, -17.56), (2.11, -18.73), (3.99, -18.28), (5.09, -16.60),
(5.69, -14.66), (6.05, -12.67), (6.33, -10.66), (6.80, -8.69),
(7.88, -6.99), (9.28, -5.52), (10.47, -3.88), (11.24, -2.01)
]
Copy the list of coordinates for the apple core to the text field in the template and tap <Create> to create the section and return to the Section Page.
A dialog box will appear if the section is not closed. Tap the OK button to close the section.
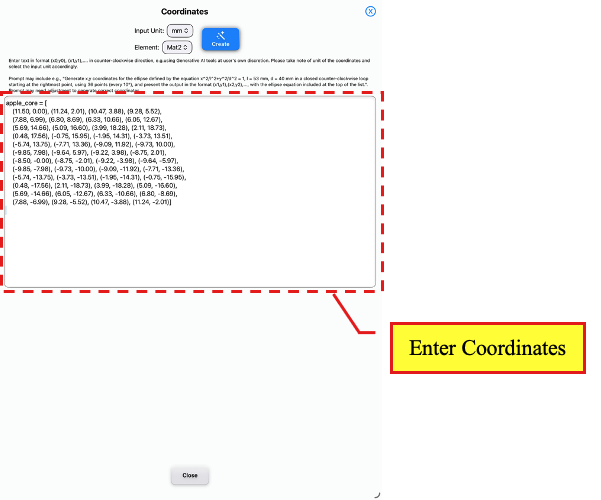
Coordinates Template Page
Change unit and enter coordinates
The next step is to create the heat transfer model.
On the Section Page, tap on the Thermal button to access the Thermal Page.
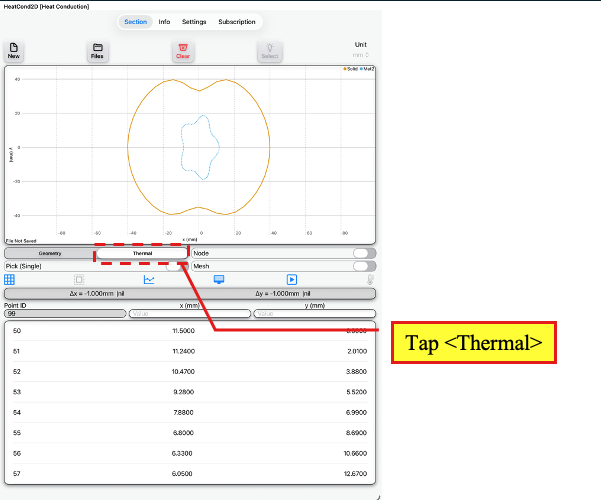
Section Page → Thermal Page
Tap <Thermal>
Next, we will generate the meshes for the model, tap on the Mesh Properties button to access the Mesh Properties Page.
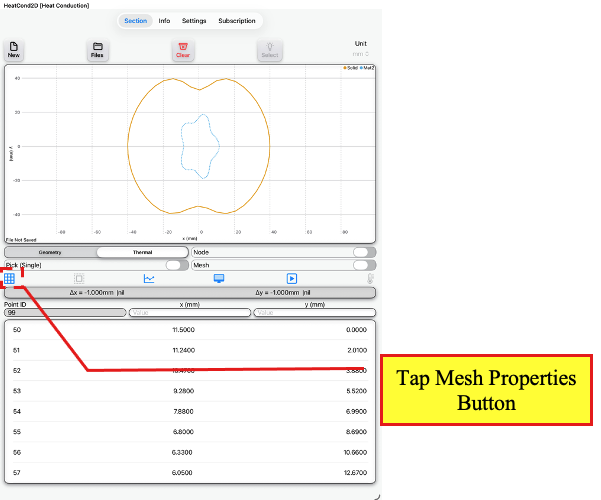
Thermal Page
Tap Mesh Properties button
On the Mesh Properties Page, tap on the Symmetry button to access the Symmetry Modelling Page.
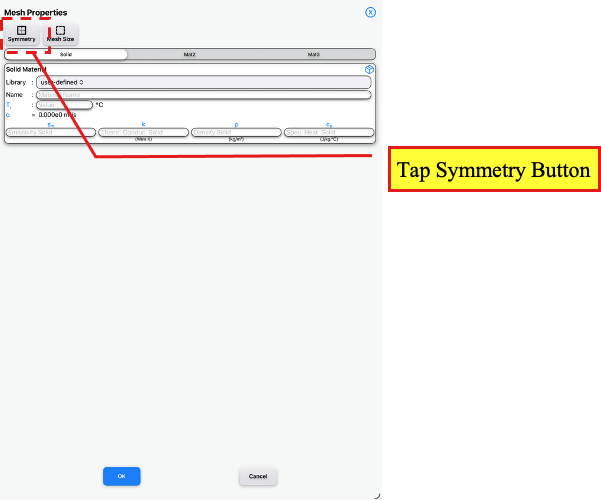
Mesh Properties Page
Tap Symmetry button
On the Symmetry Modelling Page, tap the ‘NorthWest’ corner and ‘SouthWest’ corner buttons.
Note that the apple core is not symmetry but for this example we will model half the apple so we will still use symmetry modelling.
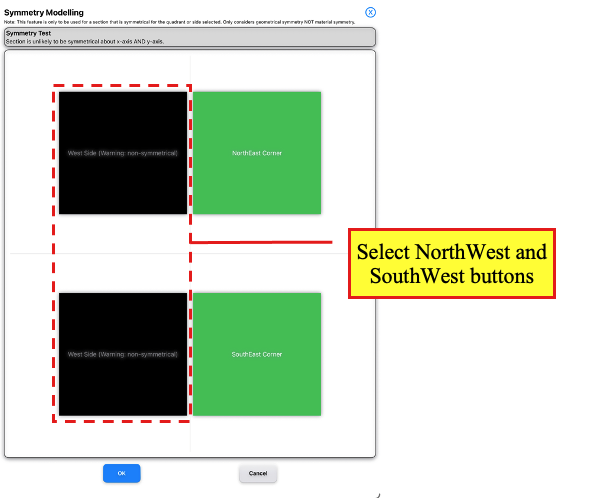
Symmetry Modelling Page
Tap NorthWest and SouthWest buttons
Tap the OK button to return to the Mesh Properties Page.
On the Mesh Properties Page, tap the Mesh Size button to access the Mesh Size Page.
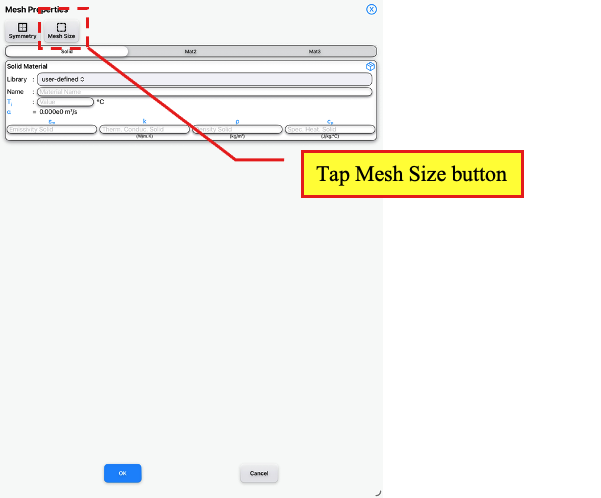
Mesh Properties Page
Tap Mesh Size button
Enter Δx of 1 in mm and Δy of 1 in mm. Leave Mesh Symmetry as ‘About y- and x- axes’ and Selected Mesh Size as ‘Modified Mesh Size’.
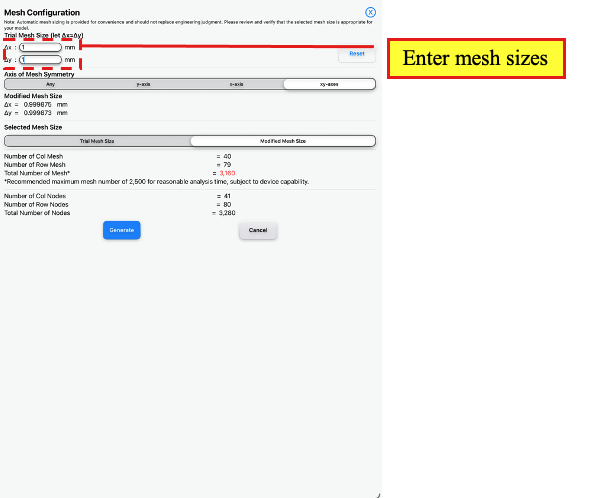
Mesh Size Page
Enter mesh sizes
Tap the Generate button to return to the Mesh Properties Page.
On the Mesh Properties Page, select <Solid> and enter the following information with the emissivity set to 1 as it is not used in the analysis:
Name: Apple Flesh
Ti: 20.0°C
εm: 1
k: 0.4 in W/m.K
ρ: 815 kg/m³
cp: 3600 J/kg.K
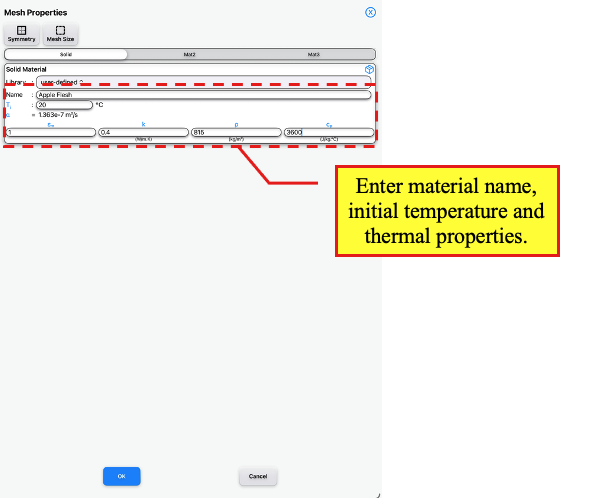
Mesh Properties Page
Under <Solid>, enter the initial temperature and thermal property values for the section
Next, select <Mat2> and enter the following information:
Name: Apple Flesh
Ti: 20.0°C
εm: 1
k: 0.35 in W/m.K
ρ: 875 kg/m³
cp: 3300 J/kg.K
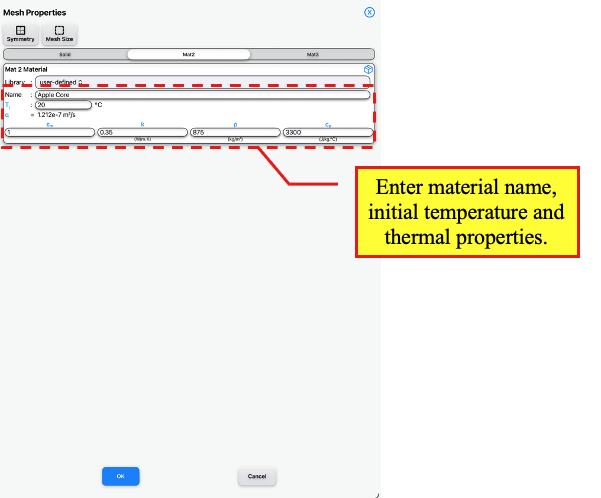
Mesh Properties Page
Under <Mat2>, enter the initial temperature and thermal property values for the section
Tap the OK button to return to the Thermal Page.
We will then apply the boundary condition to the nodes. Toggle on the Pick (Single) toggle button to Pick (Group).
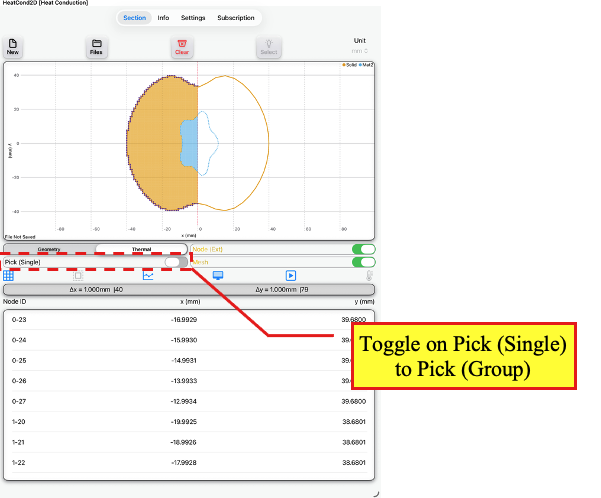
Thermal Page
Toggle on Pick (Single) toggle button
Double tap the golden Pick (Group) text of the toggle button to select all the external nodes. The selected nodes will be highlighted.
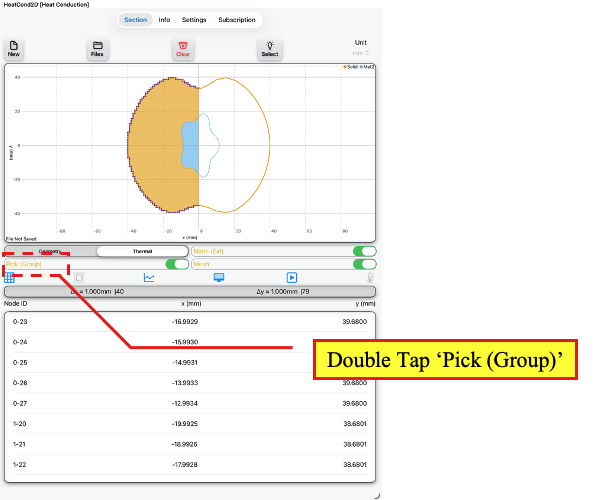
Thermal Page
Double tap ‘Pick (Group)’ text
Tap on the Boundary Condition button to access the Node Boundary Conditions Page.
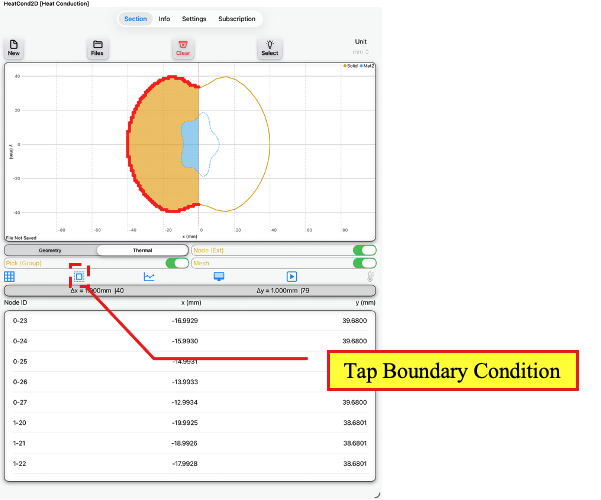
Thermal Page
Tap Boundary Condition button
On the Node Boundary Conditions Page, enter the following information:
Select ‘Surface Temp.’ as the Exposure Type
Select ‘Constant Temp.’ as the Temp. Type
Tap Conv. Loss* and enter h = 15 W/m².K
Next, enter a temperature 3°C under ‘Constant Temp.’.
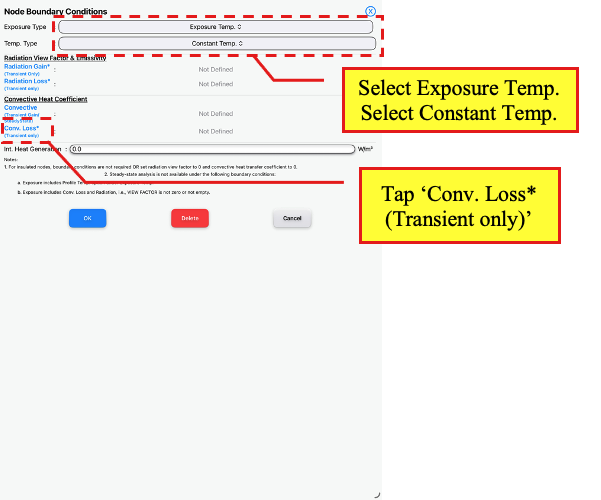
Node Boundary Conditions Page
Select ‘Exposure Temp.’
Select ‘Constant Temp.’
Tap ‘Conv. Loss* (Transient Only)‘
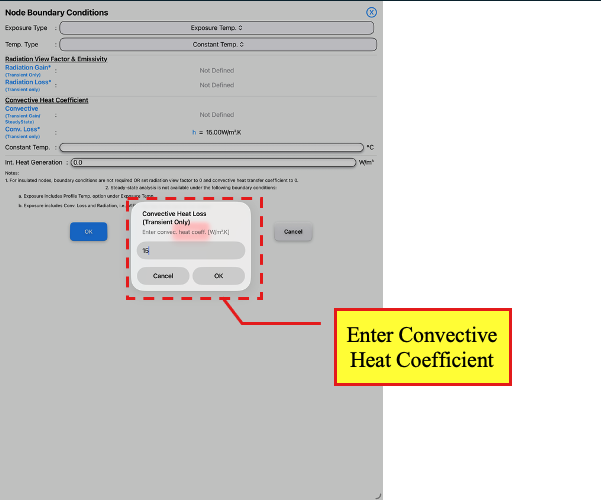
Node Boundary Conditions Page
Enter value for Convective Heat Coefficient
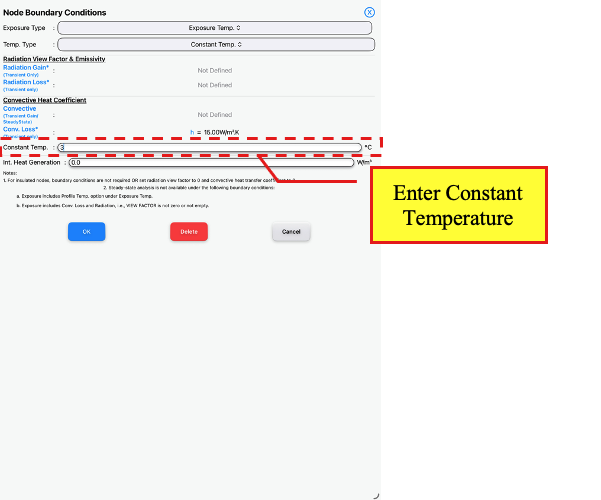
Node Boundary Conditions Page
Enter value for Constant Temperature
Tap the OK button to apply the boundary condition and return to the Thermal Page. Tap <Clear> to clear the node selection. Note that the external nodes with boundary condition applied will be marked.
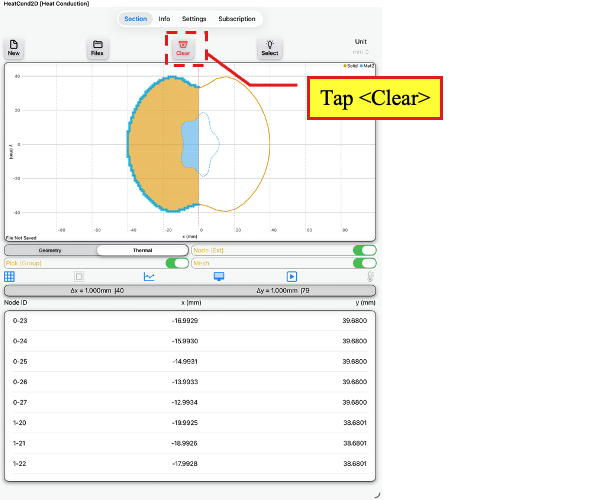
Thermal Page
Tap <Clear>
On the Thermal Page, tap the Simulation Data button to access the Simulation Data Page.
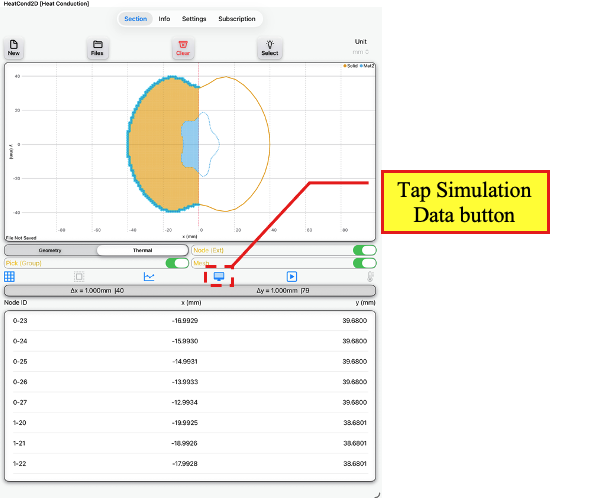
Thermal Page
Tap Simulation Data button
On the Simulation Data Page, under Solver, select Transient.
Enter a run time of 10,800 seconds and Δt of 1 second. When using the transient solver, check that for each material modelled (e.g., S1 for Solid, M2 for Mat2) that there are no red crosses under the Stability Check.
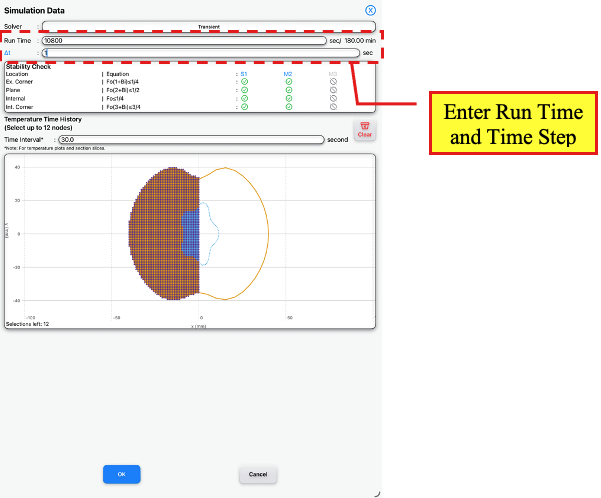
Simulation Data Page
Enter Run Time and Time Step
Tap the OK button to apply the simulation data and return to the Thermal Page.
On the Thermal Page, tap the Run button to run the heat transfer analysis.
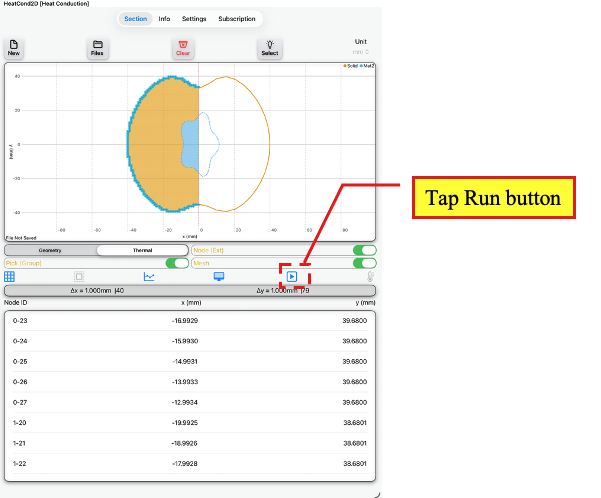
Thermal Page
Tap Run button
A dialog box will appear. Tap the OK button to continue with the analysis.
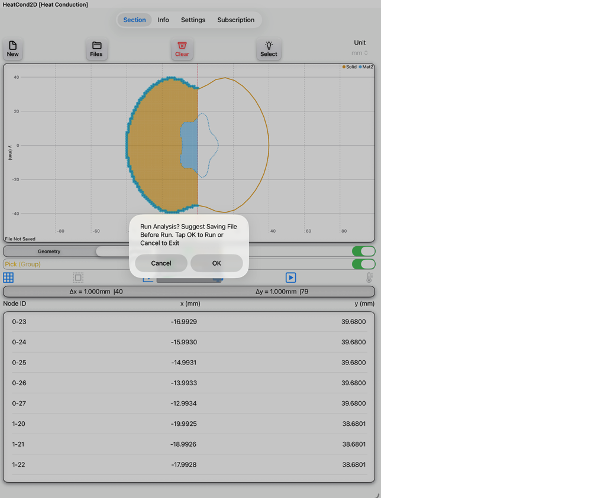
Thermal Page
Tap OK to run analysis when dialog box appears
The Results Page will automatically appear after the analysis has been completed.
Tap the bottom node of the apple section on the chart.
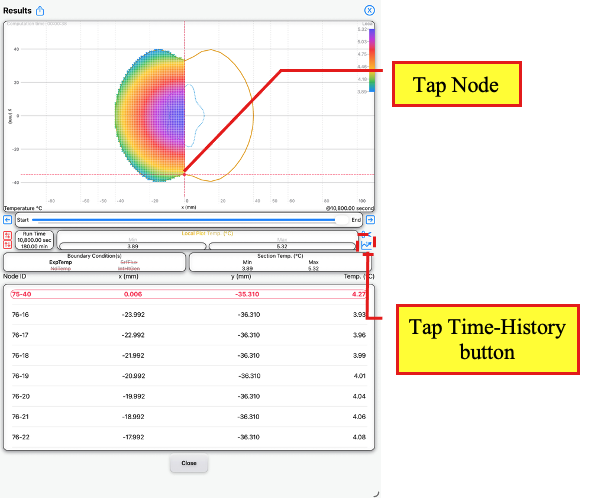
Results Page
Tap node
Tap Time-History button
Tap the time-history button (with ‘1’ showing) to view the time-history for that node. Tap the <Add> and tap <Close> to return to the Results Page.
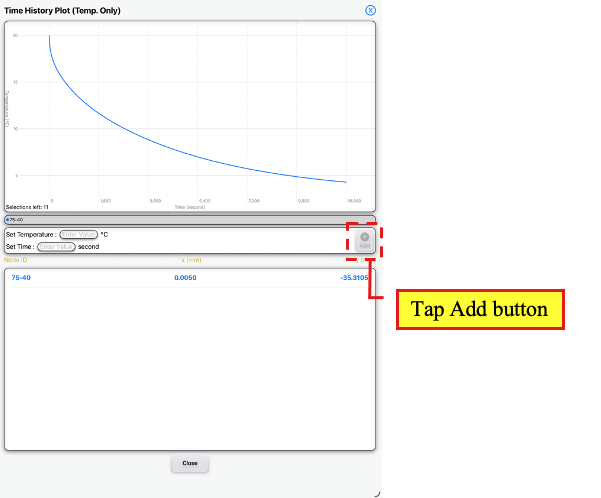
Time History Plot Page
Tap Add button
On the Results Page, tap the bottom node of the apple core.
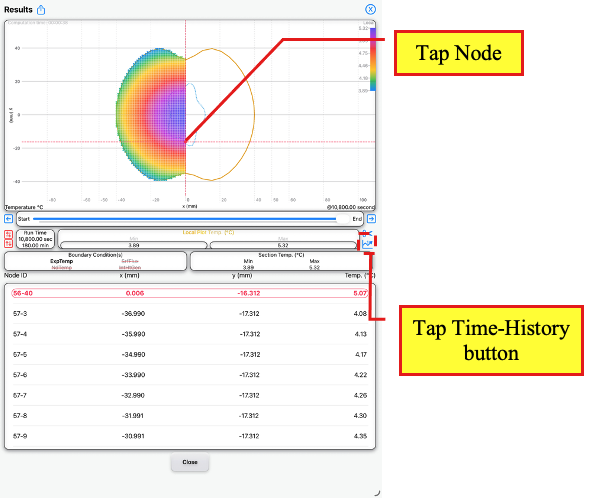
Results Page
Tap node
Tap Time-History button
Tap the time-history button (with ‘1’ showing) to view the time-history for that node. Tap the <Add> and tap <Close> to return to the Results Page.
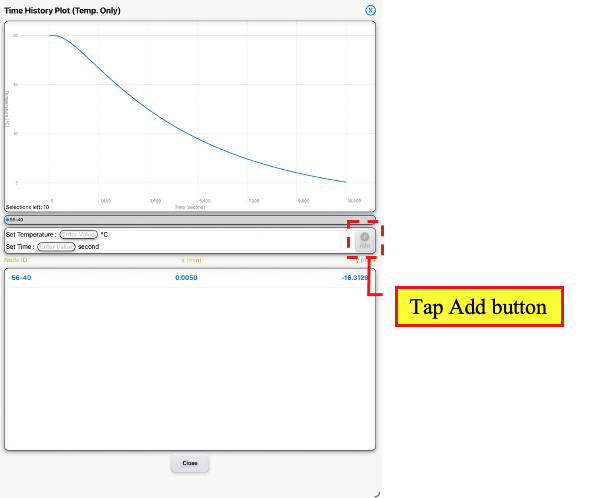
Time History Plot Page
Tap Add button
On the Results Page, unselect any node on that chart. Tap the time-history button (without ‘1’ showing).
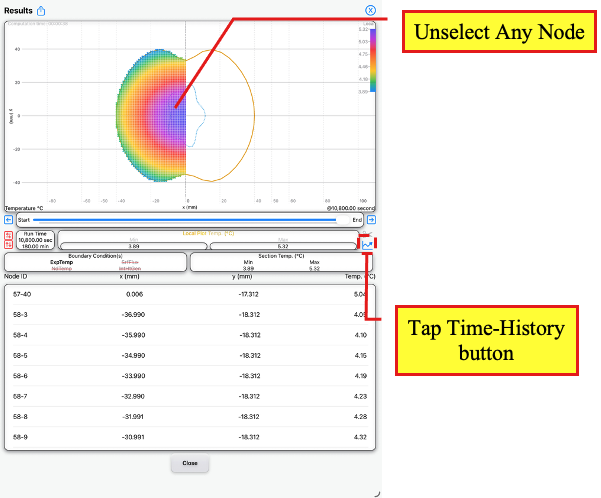
Results Page
Unselect any selected node
Tap Time-History button
On the Time History Plot Page, tap <Select All> on the chart to show the plots for all selected nodes.
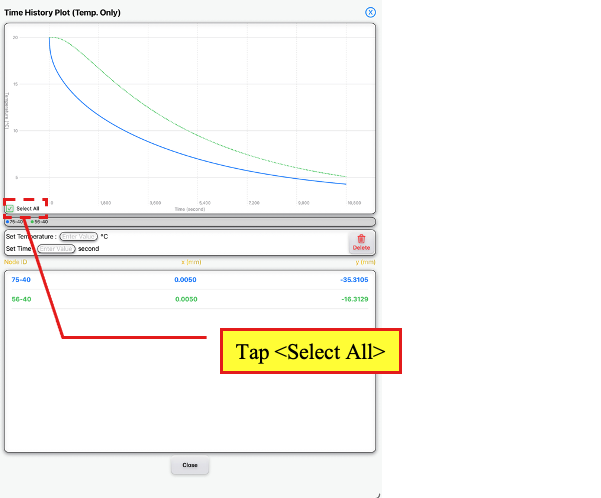
Time History Plot Page
Tap ‘Select All’
The time-history plots show that the core cools down slower than the outside of the apple exterior which is expected.
Tap on a point on the plot for the core (i.e., Node ID 56-40). The point will show that at 7,200 seconds or 120 minutes in the refrigerator, the outer core temperature is approximately 7.4°C.
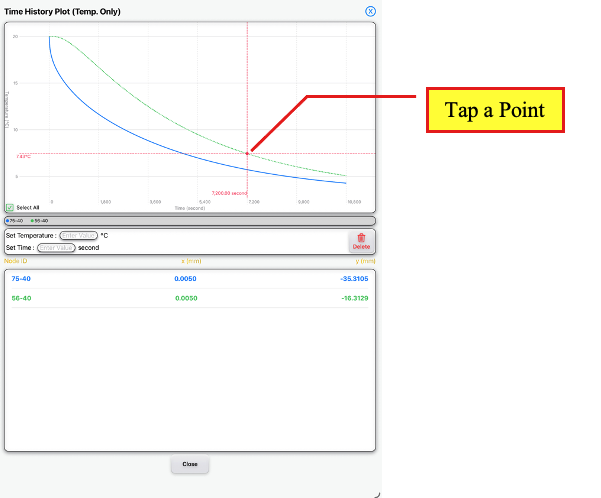
Time History Plot Page
Tap a point